MLB Total Bases Props: Hidden Value Beyond Home Runs
 Available in US
The first time I took a hard look at mlb total bases props, I expected the market to be a slightly relaxed version of HR props. It isn’t. Total bases is a different bet entirely – broader, less variant, and reliably softer at most UK books because nobody pays it the attention HR props get. A single (1 base), double (2), triple (3), or home run (4) all count, which means the prop pays on contact quality rather than power alone. That structural difference is why this is one of the few prop categories where I still find consistent edges three or four times a week without burning bankroll on variance.
This piece is the framework I use. Why total bases pays on contact more than power. The metrics that matter. The park and pitcher matchup overlay. The lineup-spot trap. And a worked example to show how the maths flips a borderline line into a clear bet.
How the Prop Pays
The standard MLB total bases prop is an over/under on a single batter’s total bases for the game. The most common lines are Over 1.5 or Over 2.5, with corresponding decimal prices typically between 1.65 and 2.50. The Over 1.5 needs the batter to produce either two singles, a double, or anything bigger. The Over 2.5 needs a double-plus, two singles, a triple, or a home run.
The implied probabilities for the standard prop lines: Over 1.5 at 1.85 implies 54 percent. Over 2.5 at 2.20 implies 45 percent. Over 1.5 at 2.10 implies 47.6 percent. The numbers move with the batter’s profile, the park, and the pitcher. The bookmaker margin on TB props is wide – 106 to 110 percent overround on most UK books – but narrower than HR props because the events are more frequent and the variance smaller.
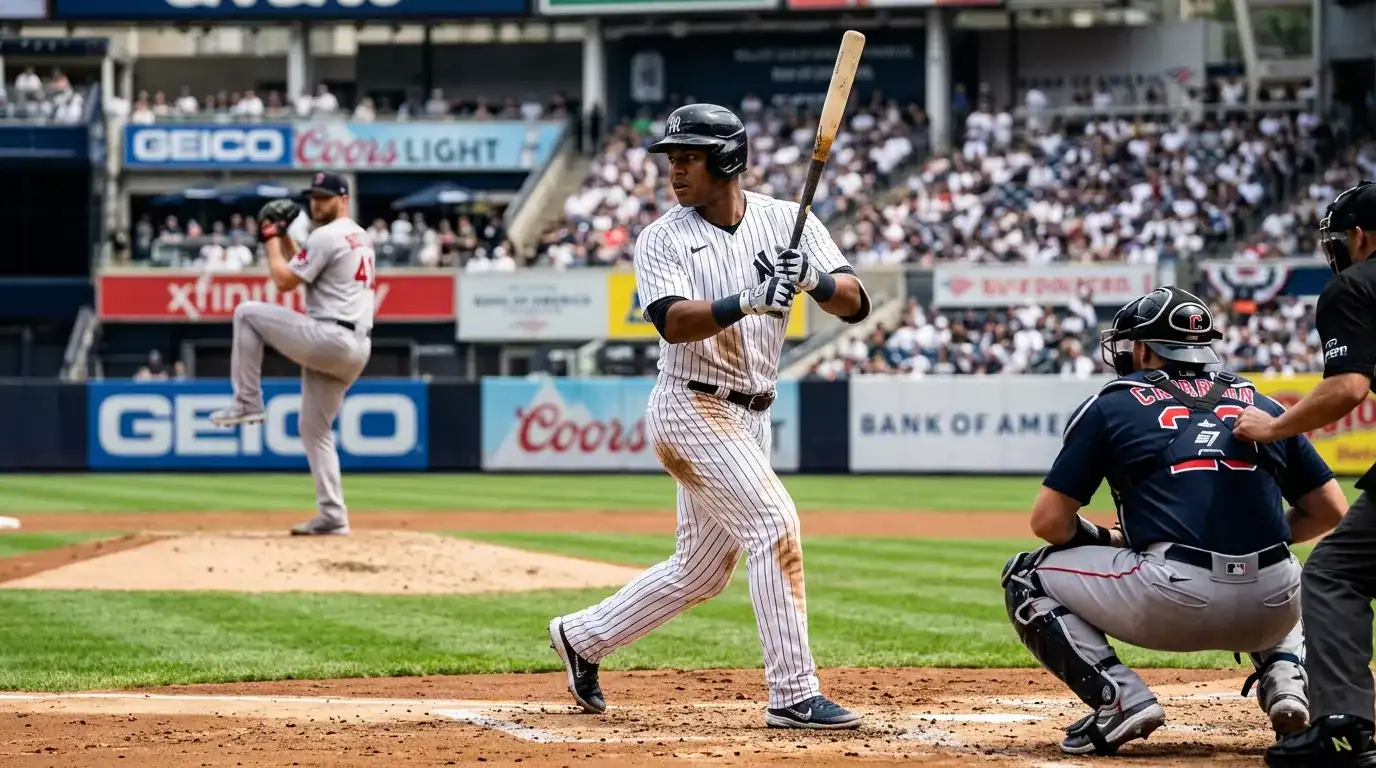
The structural feature that makes TB props attractive is the contact dependency. A batter doesn’t need to homer. He needs to get hits. For batters who put the ball in play with authority but don’t necessarily clear the wall – gap hitters, doubles producers, high-contact bats – the TB prop captures the value that HR props ignore. Those batters routinely produce 1.5 to 2.5 total bases per game without ever appearing on a HR prop board.
xSLG, ISO and Contact Quality
The metrics that predict TB output are different from the ones that predict HRs. Expected slugging (xSLG) – the slugging output you’d expect based on the quality and frequency of contact – is the single best predictor. It captures both how hard the batter hits the ball and how often. A batter with xSLG of .500 or higher is structurally producing TB output at an elite level. Below .380, the batter is a TB prop fade.
Isolated Power (ISO) – slugging minus batting average – captures the extra-base contribution. A high-ISO batter is a doubles and home runs profile; a low-ISO batter is a singles-heavy contact hitter. For Over 1.5 TB props on contact hitters, ISO matters less than batting average and on-base. For Over 2.5 TB props, ISO is critical because the bet requires extra-base output.
The third metric is line-drive percent. Line drives produce the highest hit rate of any batted-ball type – typically .680 to .720 versus league average around .500. Batters with high line-drive rates are TB-prop favourites even when their power numbers are modest, because line drives reliably become hits. Conversely, a high-flyball batter with a normal HR rate has lower TB output, because flyballs are mostly outs.
The 2025 MLB season generated 17.8 billion social media views across MLB channels, up 20 percent year on year – the most-watched season ever by that measure. That ecosystem amplifies the narrative around power hitters, which is partly why TB props on contact-quality bats stay underpriced. Casual money follows headlines. The structural xSLG-strong, low-ISO profiles get ignored.
Pitcher Matchup and Park
The pitcher facing the batter shifts TB expectations differently than HR expectations. For TB, the relevant pitcher metric is BABIP allowed and the pitcher’s hard-hit rate against. A pitcher who suppresses hard contact reliably (low hard-hit percent against) keeps TB outputs low even against good hitters. A pitcher who allows hard contact (above-average hard-hit percent against) is a TB prop target.
Groundball pitchers, surprisingly, can be TB targets in the right park. Groundballs become singles at higher rates than fly balls, and a hard groundball to the wrong side of an infielder is a TB-counting hit. The structural assumption that groundball pitchers suppress TB is partially wrong – they suppress home runs and slugging, but not necessarily hits.
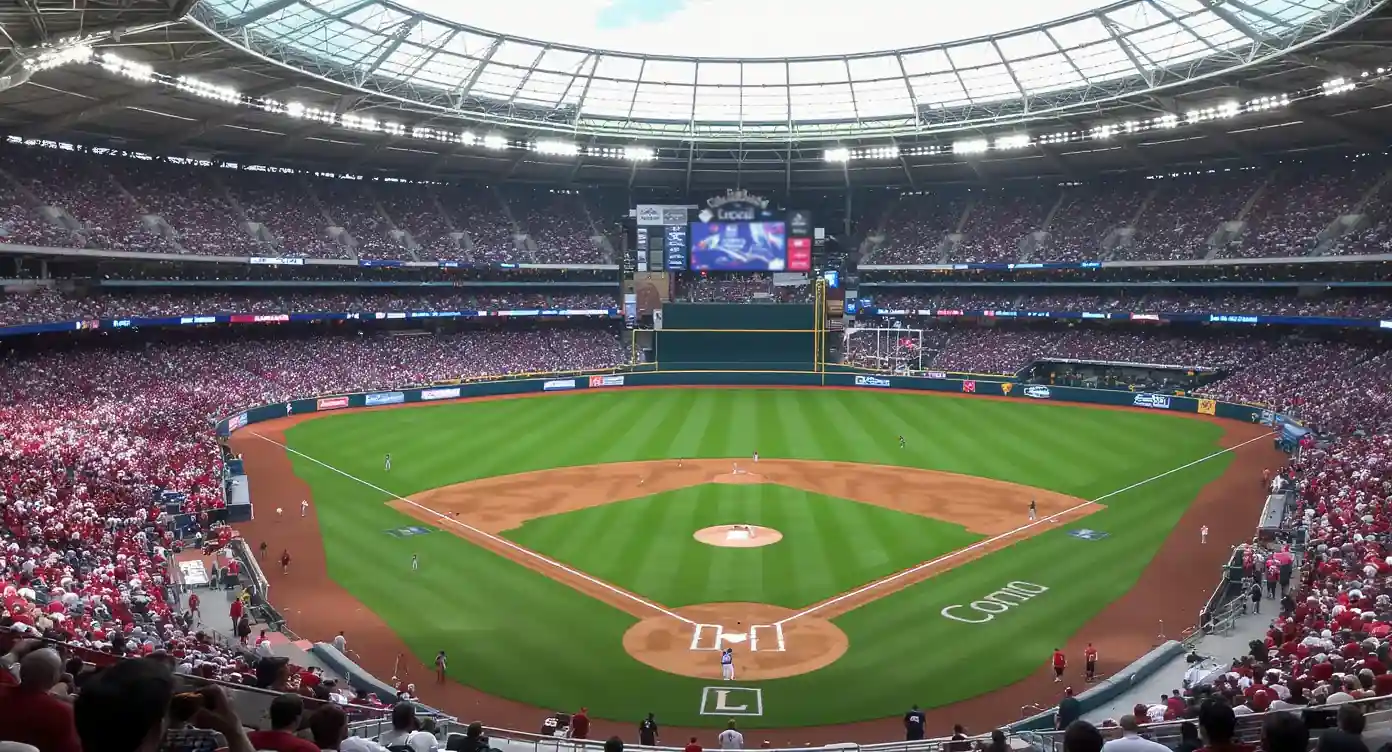
The park overlay is critical and often distinct from HR-prop park overlays. Sutter Health Park in Sacramento posted +10 percent runs and +5 percent home runs as the Athletics’ 2025 venue – but its doubles factor was higher still, around +15 percent, because the gaps in the outfield are unusually deep. That’s a TB-friendly profile that doesn’t match its HR-friendly profile, and bettors who only look at HR park factors miss it.
For doubles-friendly parks specifically – gaps, deep outfields, asymmetric fences – TB props on Over 2.5 lines for power hitters routinely offer value. The same batter at a HR-friendly cookie-cutter park is more likely to homer once and finish at exactly 4 TB; at a doubles-friendly park, he’s more likely to double twice and end at 4 TB the other way. Both ways clear the Over 2.5. The doubles-friendly profile produces 4-plus TB more often than the HR-friendly profile, even though the latter dominates the prop market’s attention.
Lineup Spot and BvP Noise
Lineup spot is the volume input. A leadoff batter typically gets 4.5 PA per game; a nine-spot batter gets 3.5. For TB props on borderline lines, the difference between top-of-order and bottom-of-order is roughly 25 percent of expected output for the same player. Always check the lineup before placing.
The trap is batter-vs-pitcher history. UK tipsters love quoting “Player X is 6-for-12 against Pitcher Y,” and applying that to a TB prop. The sample size is meaningless. Twelve plate appearances is statistical noise, and the projection from 12 PA to today’s outcome is essentially random. Treat BvP as a tiebreaker for two otherwise equivalent setups, never as a primary input. The genuine signal lives in batter contact quality against pitcher contact-quality allowed, both measured over hundreds of plate appearances. For deeper treatment of why these splits mislead, the underlying problem with batter vs pitcher stats as a betting trap is the systemic version of the same issue.
The other lineup consideration is platoon protection. A batter against an opposing-handedness pitcher (left-on-right or right-on-left) often sees their TB profile shift up because of the platoon advantage. A batter against same-handed pitching often sees a 10 to 15 percent decline in expected TB. Cross-reference platoon splits before placing.
A Worked Example
An illustrative July day game at a doubles-friendly park. Batter has xSLG .465, batting average .280, line-drive percent 24 percent, lineup spot third in the order. Opposing pitcher has hard-hit percent against of 38 percent – slightly above league average – and BABIP allowed of .305. Park has a doubles factor of +12 percent. Wind is neutral; temperature 78.
Project expected TB. Batter sees 4.2 PA. Average TB per PA for this profile is about 0.62 (driven by .280 average, .465 SLG). Adjusted for the favourable pitcher (hard-hit allowed is a small boost) and the doubles-friendly park (modest boost), expected TB rises to about 2.85. The Over 2.5 line is sitting at 2.10 (47.6 percent implied). My model implies roughly 60 percent probability of clearing 2.5 TB, giving an edge of about 12 percentage points over the displayed price.
Strip the bookmaker margin: at 108 percent overround, the no-vig fair price is about 51.4 percent. My 60 percent model estimate gives an 8.6 percentage point edge. That’s a real bet. Stake sized through quarter Kelly – about 1.5 percent of bankroll on the Over 2.5.
This is the cleanest version of the trade. Most TB prop opportunities don’t have all six inputs lining up – favourable batter profile, favourable park, weak pitcher matchup, top-of-order spot, neutral or favourable weather, and a borderline line that hasn’t fully priced the conditions. Maybe three or four TB prop slots in a typical 15-game slate meet the criteria. Those are the bets.
Why the Under Bias Is Real Here
One observation worth flagging. The TB market is biased toward unders in casual money flows. Recreational bettors follow the same headline names they would on HR props, but TB requires hits rather than homers, and the unders cash when the batter strikes out twice or grounds into a couple of weak outs. Casual bettors don’t enjoy backing the under because it feels like rooting for failure. That bias pushes overs slightly longer than fair across the prop board.
The structural under value sits with batters whose headline numbers – average, OPS, home runs – look better than their xSLG and contact quality justify. Those batters get over-bet on TB props the same way they get over-bet on HR props. The under at a fair or slightly long price on a regression candidate is a quiet ongoing edge across volume.
The total bases prop is one of the few markets where the work-to-edge ratio still favours the bettor. The data is public, the structural inputs are stable, and the casual money flows reliably enough that small but real edges keep appearing. Disciplined selection – three or four bets per slate, not ten – turns those edges into a long-run ROI that the noisier prop markets don’t offer.
Are total-base lines softer than HR-prop lines at UK bookmakers?
Generally yes. TB props see lower volume than HR props, which means UK trading desks update them less aggressively. The bookmaker margin is also slightly narrower on TB than HR (106 to 110 percent vs 108 to 112 percent), giving the bettor more room to operate. Both factors combine to keep TB lines structurally softer.
Does total bases include walks?
No. Total bases counts only bases reached via hits – singles (1), doubles (2), triples (3), and home runs (4). Walks, hit-by-pitches, and steals don’t contribute. This is worth knowing because batters who walk often but rarely hit for extra bases have higher OBP than their TB output suggests, and the TB prop can be a fade on them.
How does a doubles-friendly park inflate TB props?
Parks with deep outfield gaps or asymmetric fences turn would-be flyout outs into doubles by letting balls land beyond outfielders. Sutter Health Park, Citi Field, and Fenway are examples of venues with elevated doubles factors. The shift typically adds 0.2 to 0.3 expected TB per game for batters who hit gap-quality balls.
Published by the mlb Betting Systems team.