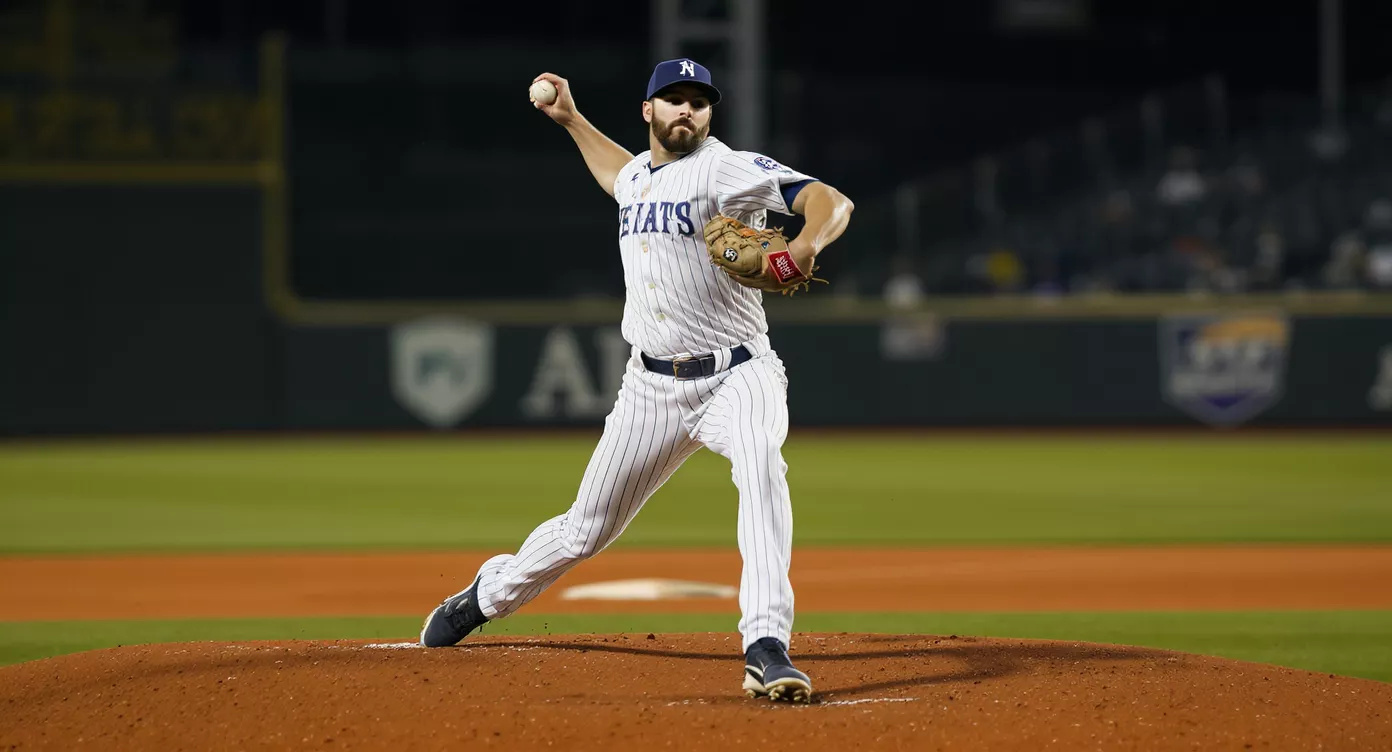
Starting Pitcher Analysis for MLB Betting: FIP, xFIP and K-BB%

In 2025, Paul Skenes finished the season with an ERA of 1.97. He was the first qualified starting pitcher to post a sub-2.00 ERA at age 23 or younger since Dwight Gooden in 1985. It is a stunning number, and it is also the perfect entry point for this guide, because if you tried to build a starting pitcher betting strategy around ERA, even with talent that historic on your card, you would lose money.
I learned the lesson the slow way. My first two seasons of MLB betting I sorted starters by ERA and pasted the column into a spreadsheet next to the opposing lineup wOBA. The results were not awful, but they were not what I expected from a column of numbers that good. The problem was not the methodology. The problem was the metric. ERA is a backward-looking summary of what happened, filtered through fielding decisions, weather, ballpark and luck. It is a useful descriptive statistic and a terrible predictive one.
The metrics that actually predict the next start, and therefore the next bet, are FIP, xFIP, K-BB% and the underlying Statcast inputs that feed into Stuff+ and similar models. These are the inputs every sharp baseball bettor checks before reading anything else, and once you start working with them you cannot go back to ERA. The lift in your hit rate is real and it does not require a model. It requires changing the column you are sorting by.
This guide walks through the metrics in the order I use them. Why ERA misleads, how FIP and xFIP rebuild the picture from inputs the pitcher actually controls, why K-BB% is the single best one-number summary of starter quality, what the Statcast layer adds on top, how platoon splits and handedness affect the read, and how workload and recent form modulate everything. The final section folds the inputs into a filter you can apply on any given slate.
Índice de contenidos
- Why ERA Misleads Bettors Almost Every Week
- FIP and xFIP: The Predictive Replacements
- K-BB% and the Swinging-Strike Tell
- The Statcast Layer: Stuff+, CSW% and Expected wOBA
- Platoon Splits, Handedness and the Reverse-Split Trap
- Workload, Rest and the Second Time Through
- Building the Filters Into a Betting System
- Frequently Asked Questions on Pitcher Analysis
- Pitcher Quality as the Anchor of Every MLB System
Why ERA Misleads Bettors Almost Every Week
A bet I lost in my first season has stayed with me as the textbook example of why ERA fails. The starter on my side had a season ERA of 2.40 over 14 starts. Headline numbers said ace. Underlying numbers said something completely different. His FIP was 4.10. His K-BB% was 8%. His swinging-strike rate was below league average. Everything that pitchers actually control said he was a back-end arm who had been running hot on batted-ball outcomes. I bet his price as if he were genuinely 2.40 quality. He gave up six runs in four innings and the bet died predictably.
The deeper problem with ERA is that it lumps three different things together. The first is the pitcher’s actual run prevention skill. The second is the quality of the defence behind him. The third is the sequence of batted-ball luck across the sample. A pitcher with a 2.40 ERA might be a 2.40-quality arm. He might also be a 4.10-quality arm pitching in front of an elite defence on a stretch where the balls in play happened to land at fielders. ERA does not tell you which one you are looking at.
The defence problem is the biggest. A starter facing a slow opposing lineup in a small park with an elite defensive alignment is going to post a lower ERA than the same starter facing a quick lineup in a big park with average defenders. Half of that gap is the pitcher and half is the context. ERA folds them together and pretends both are the pitcher.
The luck problem is just as bad in the short run. A starter with a true ERA of 4.00 will post anything from 2.50 to 5.50 across a 14-start sample on pure variance. The number is real, the underlying quality is what it is, but the spread is huge. Betting on an inflated ERA reading expecting it to continue is one of the most common mistakes in baseball handicapping.
The sample-size point is the third element. A starter has 30 starts in a season at most. Across 30 starts, ERA is just noisy enough that the rank order at the end of the year does not closely track the rank order of underlying quality. The metrics that strip out luck and defence converge to the true quality much faster than ERA does, which is why they outperform on bet-by-bet basis.
The way I think about it: ERA is the box-score number that tells the story of what happened. FIP and xFIP are the numbers that tell you what is likely to happen next. The first is for the newspaper. The second is for the bet slip.
FIP and xFIP: The Predictive Replacements
FIP stands for Fielding Independent Pitching. The idea behind the metric is simple. Strip out everything the pitcher does not control, which is to say everything that happens once the ball is in play, and rebuild a runs-allowed estimate from the inputs the pitcher does control. Those are strikeouts, walks, hit batters and home runs allowed.
The formula is straightforward enough to keep in your head. FIP is calculated as (13 times home runs plus 3 times the sum of walks and hit batters minus 2 times strikeouts), divided by innings pitched, then a constant is added to put the result on the same scale as ERA. The constant changes year to year to anchor league average FIP at league average ERA, but the relative values are what matter. A FIP of 3.00 is excellent. 4.00 is league average. 5.00 is bad. The scale is identical to ERA, which is intentional so you can compare them at a glance.
The interesting bets live where FIP and ERA diverge. A starter with an ERA of 2.40 and a FIP of 4.10 is overperforming his underlying inputs. The next ten starts will regress toward the FIP, not the ERA, on average. If the market is still pricing him as a 2.40 arm, the price on his side is overvalued and the fade is a real bet. A starter with an ERA of 4.50 and a FIP of 3.20 is the reverse case. Bad luck so far, but the underlying quality is significantly better than the headline number. The market often takes longer to adjust to these regressions than the maths says it should.
xFIP is a further refinement. The «x» stands for expected. The formula is the same as FIP, but instead of using the pitcher’s actual home runs allowed, it substitutes the league-average home run rate for the pitcher’s fly-ball total. The logic is that home run rate has high year-to-year variance, and the underlying skill is the fly-ball rate, not the home run rate. xFIP smooths out that variance and tends to be a better predictor of next-year ERA than either ERA or FIP for most starters.
The catch with xFIP is that some pitchers genuinely do allow more or fewer home runs per fly ball than league average, and the metric overcorrects in those cases. A pitcher who works at the top of the zone and lives off pop-ups will have a lower home run per fly ball rate that is partially skill, not pure variance. xFIP will overestimate his runs allowed.
In practice, I use both. FIP for short-sample reads and recent-form weighting. xFIP for season-long projections and matchup quality. If both are well below ERA, the market has not yet priced the starter correctly. If both are well above ERA, the starter has been running hot and is due for a correction.
K-BB% and the Swinging-Strike Tell
If you forced me to pick one metric for evaluating a starting pitcher and threw out everything else, I would pick K-BB%. It is the percentage of plate appearances ending in a strikeout, minus the percentage ending in a walk. Two numbers, one subtraction, and the result tracks pitcher quality more cleanly than any other single input you can pull off a public website.
The reason it works is intuitive once you sit with it. Strikeouts are the cleanest positive outcome a pitcher can produce. The ball never gets to a fielder, the batter is retired, no luck or context required. Walks are the cleanest negative outcome. The pitcher gives up a baserunner without the batter doing anything. K-BB% takes the difference between the good thing a pitcher does on his own and the bad thing he does on his own, ignoring everything that happens with the ball in play.
The reference values are worth memorising. League average K-BB% sits around 13-14%. A top-quartile starter is at 20% or higher. A bottom-quartile starter is at 8% or lower. Anything north of 25% is genuinely elite. Anything south of 5% is a back-end rotation arm who is going to lose money for anyone who bets on him as a favourite.
The trap that catches new bettors is sorting by K% alone. A pitcher with a 30% strikeout rate looks like an ace. If his walk rate is 12%, his K-BB% is 18%, which is good but not exceptional, and his actual run prevention will reflect the walks. Always subtract the walks before reading the K-rate.
The companion metric I check alongside K-BB% is SwStr%, the swinging-strike rate. This is the percentage of pitches that batters swing at and miss. It is the leading indicator that supports the K-rate. A pitcher with a high K-rate and a low SwStr% has probably been getting strikeouts on called third strikes and pitches in the zone that the batter took. That is a less stable pattern than a pitcher with a high K-rate and a high SwStr%, who is getting batters to swing through pitches and is therefore likely to sustain the K-rate going forward.
The numbers to know on SwStr%: league average is around 11%. Elite is 14% or higher. Below 9% is a warning sign even on a pitcher with a flashy K-rate. The combination of high K-BB% and high SwStr% identifies starters whose run prevention is real and durable. The combination of high K-rate and low SwStr% identifies starters who have been running hot and are likely to regress.
For UK punters interested in betting individual strikeout props as well as starter-led moneylines, the article on strikeout props covers how to read pitcher K-lines and find value in the prop market specifically. The same metrics that drive your starter quality reads also drive the strikeout prop edges, which is why the two markets pair well in a research workflow.
The Statcast Layer: Stuff+, CSW% and Expected wOBA
The Statcast era changed pitcher analysis in ways that took the betting market five or six years to catch up to. Before 2015, pitcher quality was inferred from outcomes. After Statcast, pitcher quality could be measured directly through pitch-level data: release speed, spin rate, movement, location, and the result of every swing the batter took. The metrics that come out of that data layer are the cutting edge of pitcher evaluation today.
Stuff+ is the headline number. It is a model output that scores the quality of a pitcher’s individual pitches relative to league average, expressed on a scale where 100 is league average and every 10 points represents one standard deviation. A starter with a Stuff+ of 110 has pitch quality one standard deviation above league average. 120 is two standard deviations above. The metric weights velocity, movement and location into a single number that correlates strongly with future K-rate and run prevention, even when current outcomes have not caught up to the underlying quality yet.
The reason Stuff+ matters for betting is that it leads K-BB% by a month or two. A starter whose Stuff+ has been creeping up but whose K-rate has not yet followed is in a profile where the next few starts are likely to improve. That is a betting edge, because the market is still pricing the K-rate. By the time the K-rate catches up, the price has tightened. The window for the bet is the gap.
CSW% is the second Statcast metric I check. It stands for Called plus Swinging Strike rate, the percentage of pitches that result in either a called strike or a swinging strike. The reference values are around 30% for league average and 33% or higher for elite. CSW% combines the pitcher’s ability to locate in the zone and his ability to get swings and misses.
Expected wOBA against, or xwOBA, is the third Statcast input that matters. wOBA is a weighted on-base average that translates every batting outcome into a run-value-adjusted number. Expected wOBA is the version calculated from launch angle and exit velocity of every batted ball, rather than from actual results. A starter with an xwOBA against him of 0.290 is generating contact quality that league hitters convert into a 0.290 wOBA, regardless of whether the balls happened to land at fielders on the actual day.
The combination I look for is Stuff+ above 105, CSW% above 31%, and xwOBA against below 0.310. When all three are present, the starter is genuinely elite at suppressing offence, and the bet on his side is supported by underlying inputs across multiple measurement systems. When one of the three is missing, the starter is good but not bulletproof, and the bet is conditional on the other inputs lining up.
Where to find the data: Baseball Savant publishes the Statcast inputs for free, and most of the public sites have summary pages that aggregate Stuff+, CSW% and xwOBA against alongside the traditional metrics.
Platoon Splits, Handedness and the Reverse-Split Trap
The platoon advantage in baseball is the simplest and oldest read in the book. Right-handed batters hit better against left-handed pitchers, left-handed batters hit better against right-handed pitchers. The effect is real and it shows up in every credible analysis of hitting outcomes over the last sixty years.
What is less straightforward is how to use it in a betting context. The platoon read is not «lefty starter is bad against righty lineup». It is more granular than that. Different pitchers have different platoon splits based on the pitch arsenal they throw. A right-handed pitcher whose primary secondary pitch is a slider that breaks away from righty batters will struggle against lefty lineups, because the slider has the opposite movement profile against a lefty hitter and becomes a hangable pitch in the middle of the zone. A right-handed pitcher whose primary secondary is a changeup that moves toward righty batters will be relatively neutral against lefty lineups because the changeup retains its movement effectiveness.
The reverse-split trap is the one that catches more punters than any other. A «reverse split» pitcher is one whose handedness numbers go the wrong way: a right-handed pitcher who is actually better against left-handed batters than right-handed batters, or vice versa. The cause is almost always pitch mix. A righty with a deep arsenal of arm-side pitches (sinker, changeup, two-seamer) will often run reverse splits because his arsenal works better against lefty hitters even though conventional wisdom says it should be the other way around.
Reverse splits are not stable in small samples. A pitcher might have a reverse split over 50 plate appearances on pure variance. Reverse splits become bettable after roughly 300 plate appearances against each handedness. Below that threshold, treat the reverse split as a flag worth checking, not a confirmed pattern.
The way I incorporate splits into the read: I check both the season-long splits and the career splits before any pitcher bet. If a pitcher is significantly better against one side of the plate, I look at how the opposing lineup is constructed. A lineup that is heavy on righties facing a righty pitcher with a strong same-side split is a favourable matchup for the pitcher. A lineup balanced across handedness, or stacked on the opposite side from the pitcher’s strong split, is unfavourable. The strength of the read scales with the size of the split: a 50-point wOBA gap is significant, a 10-point gap is noise.
One pattern worth flagging. Switch-hitters partially neutralise the handedness read, because they choose which side to bat from based on the pitcher. A lineup with two or three switch-hitters in the top five spots is essentially handedness-neutral against any starter. That collapses one of the inputs you might have been counting on.
Workload, Rest and the Second Time Through
The night-before research has to include workload, not because the metric is glamorous, but because it modulates everything else. A starter with a top-quartile K-BB% who is on three days’ rest after throwing 115 pitches is not the same pitcher as the same starter on five days’ rest after throwing 90 pitches. The metrics underestimate the gap.
The numbers that matter on workload are: pitch count of the last start, days of rest since the last start, and pitch count over the rolling three-start window. The first two are obvious, the third is where most casual punters miss the signal. A starter who has thrown 100, 105 and 115 pitches in his last three starts is on a workload trend that catches up to him in subsequent starts even if the headline numbers still look fine.
The second-time-through-the-order effect is the related phenomenon worth knowing. Hitters perform measurably better against a starter the second time they see him in a single game than the first time, and significantly better the third time than the second. The effect compounds across the start, which is why even good starters tend to give up most of their runs in the fifth and sixth innings rather than the first three. A starter whose pitch count is approaching 75 by the fourth inning is going to face the heart of the lineup for a third time with reduced stuff. That is the inning where the lead gets surrendered.
From a betting perspective, the workload read is most useful as a fade. A starter with elite headline numbers on short rest after a heavy pitch count is a candidate to underperform his price. The market often does not adjust enough for these conditions because the headline numbers are seductive. Taking the opposing side, or skipping the bet entirely, is the disciplined response.
The reverse case, a starter on extra rest after a manageable pitch count, is a slight positive flag but the market typically prices it correctly. The opportunity is in the negative case, the overworked starter the market is still treating as fresh.
Recent form matters too, but with caveats. A starter coming off a great three-start stretch is sometimes genuinely improving and sometimes running hot. The way to tell is the underlying inputs. If the K-BB% and SwStr% are climbing alongside the headline numbers, the improvement is real. If the headline numbers are improving but the inputs are flat or declining, the run is regression bait and the price is overheated.
Building the Filters Into a Betting System
Here is the filter I run on every starter before placing a bet. It folds the inputs above into a single decision tree that takes about three minutes per game once you are familiar with the workflow.
Step one: K-BB% above 18% and xFIP below 3.50. This is the quality threshold. A starter who clears both is genuinely above average, and the bet on his side has a credible underlying foundation. A starter who fails one or both is either back-end quality or running on outcomes that will regress. Skip the bet unless there is a specific contextual reason to override the filter.
Step two: Stuff+ above 105 and CSW% above 31%. This is the Statcast confirmation. If both are present, the underlying pitch quality matches the outcome metrics and you have multi-system agreement. If only one is present, the read is partial and the bet should be sized smaller. If neither is present, the headline metrics from step one are likely the product of a soft schedule or favourable park-defence context, and the bet is fragile.
Step three: opposing lineup wOBA against the pitcher’s handedness below 0.310. The starter’s quality is half the equation; the opposing lineup’s quality is the other half. Even an elite arm gets in trouble against a top-five offence. The 0.310 threshold is approximately league average. Anything above that is a strong-offence matchup that scales down the read.
Step four: workload check. Days of rest is five or six, pitch count of the last start was below 105, three-start rolling pitch count is below 320. If any of these fails, the bet is conditional on the price being attractive enough to compensate. If all three pass, the starter is in a sustainable workload pattern.
Step five: park and weather. Park factor is below 102 for an unders-leaning bet or above 102 for an overs-leaning bet. Wind direction is consistent with the bet thesis. Temperature is in the expected range for the run-environment projection.
When all five steps clear, the bet is what I would call a clean F5 moneyline play. The underlying pitcher quality is real, multi-system confirmed, the opposing matchup is favourable, the workload is sustainable, and the conditions support the read. These are the bets I size up on.
When three or four steps clear and one or two are marginal, the bet is taken at standard stake. When two or fewer clear, the bet is passed regardless of how attractive the price looks. A friend who works as a betting analyst once put the philosophy of systems neatly: I have long been a proponent of betting systems in all sports. The beauty of systems is not how a particular team is trending, rather, a system is a specific set of parameters and a team either fits it or it doesn’t. Pitcher-led systems work because the parameters are precise and the inputs are stable. They fail when you start fudging the thresholds to fit a bet you wanted to make anyway.
One last note. The 2025 season produced four hitters with 50+ home runs (Raleigh, Schwarber, Ohtani, Judge), matching the historical single-season maximum. The offensive environment is genuinely live, which means the threshold for what counts as an elite starter has shifted slightly. A K-BB% of 18% in 2025 is roughly equivalent to 16% a decade ago. Calibrate accordingly when reading career numbers against current numbers.
Frequently Asked Questions on Pitcher Analysis
The questions that come up most often when I am walking somebody through this framework for the first time.
Is FIP more predictive than ERA for MLB betting?
Yes, materially. ERA mixes the pitcher’s skill with the quality of his defence and the variance of batted-ball outcomes, none of which the pitcher controls. FIP rebuilds the runs-allowed estimate from inputs the pitcher does control: strikeouts, walks, hit batters and home runs. Over a 30-start season, the gap between FIP and ERA is often half a run or more in either direction, and the next-season ERA tends to converge toward this season’s FIP, not the other way around. For betting purposes, FIP gets you closer to the predictive truth, especially when the gap to ERA is wide.
What K-BB% threshold separates elite from average starters?
League average K-BB% is around 13-14%. A starter at 18% is clearly above average. 20-22% is top-quartile, the realm of borderline All-Stars. Above 25% is genuinely elite, the rarefied air of Cy Young candidates and best-in-baseball arms. The threshold worth using for betting purposes is 18%: above that, the starter is reliably better than league average and the bet on his side has a credible foundation. Below 8% is bottom-quartile, where the pitcher is going to lose money for anyone who bets on him as a favourite. The middle band of 8-18% is where most of the rotation sits and where the supplementary metrics start to matter more.
How do I find FIP and xFIP for UK pre-game research?
Both metrics are published on Baseball Savant, FanGraphs and most of the public-facing stats sites that cover MLB. The pages typically refresh nightly after the day’s games, so by the time you are researching the next day’s slate, the numbers reflect everything up to and including the previous night. You do not need a paid data feed for the standard metrics: FIP, xFIP, K-BB%, SwStr%, and the basic Statcast inputs are all available for free. The paywall is only relevant if you want pitch-by-pitch data or proprietary models like Stuff+ from specific providers.
Does a pitcher’s last-start pitch count matter for the next bet?
It matters when it is unusually high. A starter who threw 105 or fewer pitches last start is in normal range and his next start is largely a function of his underlying quality. A starter who threw 115 or more pitches last start is at elevated risk of underperforming his projection, especially if he is on standard four days’ rest. The effect is bigger than most casual punters appreciate. Pair it with the three-start rolling pitch count, and the workload signal becomes a meaningful modulator on top of the headline metrics.
Pitcher Quality as the Anchor of Every MLB System
The starting pitcher is the single largest input on any baseball bet you can place. Forty to fifty percent of the implied edge on a given day flows through that one roster slot. Get the pitcher read right and the bet has a foundation to stand on. Get it wrong and the rest of the analysis is decoration.
The metrics that actually predict pitcher performance are not the ones that show up on the broadcast graphic. ERA is for the newspaper. Wins are for the highlight reel. The numbers that move money are FIP, xFIP, K-BB%, SwStr%, Stuff+, CSW% and xwOBA against. Each captures a different angle on the same underlying question: how much offence is this pitcher likely to suppress in the next start, conditional on the opposing lineup and the conditions of the day?
The shortcut for anyone starting out is this. Sort your slate by K-BB% before reading anything else. The starters in the top quartile of that column are the ones whose prices are worth investigating. The starters in the bottom quartile are the ones whose opponents are worth investigating. Everything else, the names you recognise from television and the ERA columns that catch your eye, is decoration.
Escrito por los editores de «mlb Betting Systems».