MLB Totals Strategy: How to Bet Overs and Unders Profitably
 Available in US

The first MLB totals bet I ever cashed felt like a fluke. April 2018, Marlins at Pirates, total 7.5, posted at PNC on a 48-degree night with a 12 mph wind blowing straight in. I took the under at -115, watched both starters retire ten batters in a row, and the final read 2-1. Eight years later, I still think of that night when someone asks me where to start with an mlb totals over under strategy. The answer is unglamorous: you start with the conditions, not the teams.
Totals are the market where casual UK money tells on itself most loudly. Casual bettors love overs because watching runs is more entertaining than watching scoreless innings, and bookmakers price that preference into the line. The disciplined approach inverts the instinct. You separate the inputs that actually move totals – pitcher form, lineup health, park, temperature, wind, umpire zone – from the inputs that feel like they should but barely register on the scoreboard. Once you do, the structural advantage of betting unders in an inflated offensive environment becomes obvious. This is a market built for patience, for selective action, and for ignoring the headline scoreboard chatter that dominates UK MLB Twitter at lunchtime.
How the Total Is Built Before You See It
I once asked a former trader at a high-street book how he set MLB totals on a Tuesday morning. His answer: he didn’t. The models did. He just shaded the output by half a run depending on which way the public would lean. That’s the honest picture of how totals come together at most UK shops.
The model starts with projected runs per side. For each team, the inputs are roughly: starting pitcher’s expected runs allowed per nine innings, the strength of the projected lineup against that handedness, and a bullpen factor weighted by recent usage. Two team-level projections get summed, then adjusted by the park factor of the venue and the weather forecast at first pitch.
Park factor is where most casual punters stop. The deeper layer is the umpire. A pitcher-friendly home-plate umpire can compress the zone outward by a few inches, which shifts strikeout rates by two to three percentage points and shaves around a quarter of a run off the projection. Lineup health matters more on totals than on moneylines, because a missing power bat changes the home-run distribution rather than the win probability. If the cleanup hitter is a late scratch, the total can drop half a run within minutes of the lineup card going public.
Bullpen depth is the input bettors underweight most. Starters cover about five innings on average. I check pen usage from the previous three days before I look at the posted number. If both pens have been bled across a doubleheader, I lean over. If both are rested with three or four high-leverage arms available, I lean under.
Why 2025 Distorted the Baseline
Last season broke an old assumption that took me years to internalise. Four hitters reached 50 home runs in the same campaign – Raleigh, Schwarber, Ohtani, and Judge – matching the all-time single-season high. I still remember refreshing the standings on a Sunday in late September and seeing all four within touching distance with two weeks left. The offensive environment was historically loud. Posted totals reflected it: 9 and 9.5 became the median for non-pitcher-duels, and 10s appeared more often than they had any right to.
That noise creates two distortions. First, the public chases the previous night’s slugfest. If three games went 13-9 on Saturday, Sunday’s totals get hammered on overs by Monday morning. Bookmakers shade the openers upward to absorb the pressure. The result is overpriced overs and structurally underpriced unders on any game with a strong pitching matchup. Second, modelling itself gets jittery – projections rebuilt mid-season pull recent power surges forward, and a two-week hot streak can move a team’s projected runs by half a run when the underlying skill hasn’t changed at all.
August Young framed this well: “When betting on Major League Baseball it’s imperative to search for buy-low opportunities to maximize potential return. Baseball is such a variant driven sport with a lot of randomness involved. Taking advantage of incorrect bias or oddsmakers over-adjustments can be the key to unlocking a profitable season.” That quote lives on my desk for a reason. The 2025 inflated offence is exactly the kind of “oddsmakers over-adjustment” he describes. Totals shaded too high in the wake of headline-grabbing power surges create the most reliable buy-low under opportunities I have seen in eight years of betting this market.
The lesson I took into 2026 is simple: when the offensive environment runs hot, the disciplined money is on the unders, and the lazy money is on the overs. The lazy money pays the disciplined money’s rent.
Weather as a Totals Filter
I have a rule that has saved me more than any other: I never bet a daytime total in summer without checking the wind forecast first. Not the daily forecast – the first-pitch forecast at the specific venue. Wind is the most underpriced input in MLB totals, and it is the single weather variable that consistently produces value.
The physics are tidy. Temperature adds roughly 1% to a fly ball’s distance for every 10°F increase, and the same 1% applies for every 800 feet of altitude. A 90-degree afternoon at low altitude is a meaningfully bigger ball than a 60-degree evening, but the effect is gradual and most models bake it in. Wind is different. Wind is binary: it either helps or hurts the ball, and the magnitudes are large. Games with wind blowing toward the outfield produce 5.8% more runs and 7.6% more home runs than games with neutral or in-blowing wind. That second number – 7.6% – is the one I think about. A nominal 9.5 total becomes a true 9.0 or even 8.5 with a 12 mph in-blowing wind, and posted lines almost never move the full distance.
The way I use this is simple. Three hours before first pitch, I pull the venue weather. I look at wind direction relative to park orientation and cross-reference with the posted total. If wind is in and the total is high, I lean under. The cleanest edges sit at venues where wind matters most: Wrigley, Kauffman, Citi Field, Oakland Coliseum, and Fenway. Consistent unders at high-wind-in totals in those parks is one of the few repeatable angles I can recommend without hedging.
Humidity matters less than people think. Drag goes up slightly with humidity, but the magnitude is small enough that I treat it as noise unless the forecast pushes into extremes. The decisive weather variable is wind, full stop.
The Under as the Disciplined Bet
Most casual UK punters bet overs. The reasons are not financial – they are emotional. Watching a 2-1 game for three and a half hours is less fun than watching a 9-7 game. Rooting for runs gives you something to do every half-inning. Rooting for no runs feels passive, almost negative. The market reflects this preference, and that asymmetry is where the under edge lives.
Consider what an under bet actually rewards. A pitcher’s duel. A cold night. A wind that kills carry. A tired bullpen replaced with another tired bullpen. Defensive plays. Bad weather delays. Anything that suppresses scoring works for the under bettor. The list of things that produce runs is shorter than the list of things that suppress them, and yet posted totals price the inverse: overs at -110 to -115, unders frequently at +100 or better.
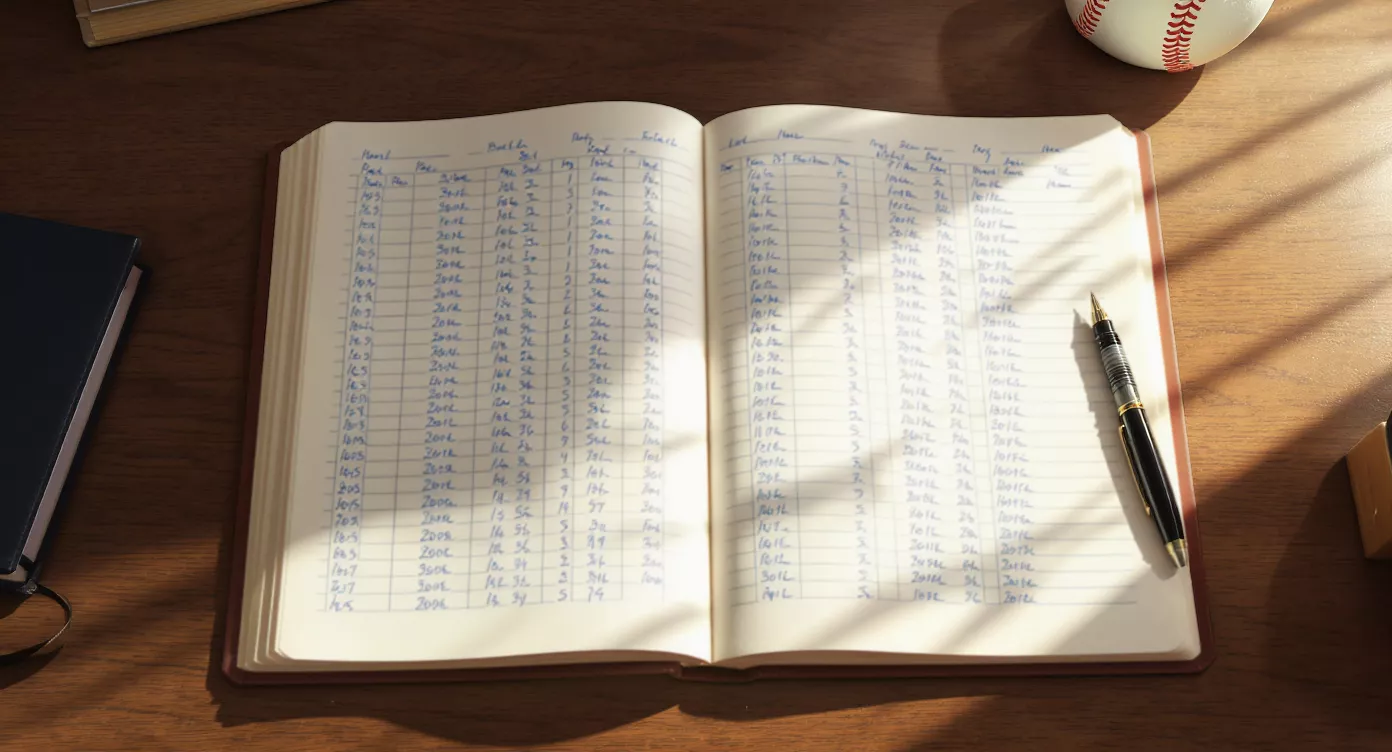
I keep a private record of every total I bet, split by over and under. Across the last four seasons, my under-only record has been profitable by a margin my over-only record cannot match. The variance is lower too. A wind-in forecast holds for six hours. A tired bullpen does not magically recover. But the offensive explosion that pushes a total over is usually one swing, one mistake pitch – discrete, unpredictable. The over bettor needs lightning. The under bettor needs the absence of lightning, which is the default state of the universe.
This is not a blanket recommendation to bet unders. It is a recommendation to understand why unders are structurally underbet and to use that asymmetry when the conditions align. If you find yourself wanting to bet an over because you “like” the matchup, stop and ask whether you would still bet it at -125. If the answer is no, you are betting the wrong side.
A Worked Example from Last Season
July 2025, Pirates at Cubs, Wrigley Field, 13:20 local start. Total opened at 8.5, drifted to 9 by morning of game day. I pulled the forecast: 71°F, 14 mph wind blowing in from centre, cloud cover heavy. The starters were Skenes for Pittsburgh, who had pitched into the seventh in four of his last five starts, and Steele for Chicago, also in form. Both pitcher-friendly umpires were in the rotation, with the home-plate ump grading in the 85th percentile for called strikes that season.
I priced the total myself: 4.0 projected for Pittsburgh, 3.6 for Chicago, totalling 7.6. The wind discount alone pulled another 0.4 off. My model said 7.2. The market said 9.0. That is a full one-and-a-half-run gap, which in MLB totals is enormous.
I took the under 9 at -105. The game ended 3-2 over eight and a half innings. Skenes went seven, allowed one earned run, the wind held all afternoon, and the Cubs’ two-out rally in the eighth died on a fly to right that on a calmer day would have cleared the basket. The bet was not lucky. It was the predictable outcome of a market that had drifted away from the conditions. I have linked this kind of in-game analysis in detail in my breakdown of how altitude and weather reshape Coors Field totals, where the principles transfer directly to any venue with strong park effects.
The worked example is not the bet. The worked example is the process: posted line, my own projection, weather discount, umpire grade, bullpen state. Five inputs, two minutes of work per game, every day of the season. The bet only happens when the gap is large enough to overcome the vig. Most days, there is no bet.
What This Strategy Is and Is Not
This is not a system that wins 60% of the time. Nothing in MLB totals wins 60% of the time over a meaningful sample. This is a framework for finding the games where the posted line and the true projection diverge enough to overcome the bookmaker’s edge. On most nights, no game qualifies, and the right action is no action. On the nights when one or two games qualify, the discipline is to bet only those and at a stake size that does not blow up when variance turns against you. The under bias is structural; the wins are not.
Why do most casual MLB bettors prefer overs?
Overs feel like rooting for action. Watching runs score is more engaging than watching scoreless innings, and that emotional preference is built into how books price totals. Overs typically carry slightly worse odds than the underlying probability justifies, which is the structural reason patient bettors gravitate toward unders.
Should the total move because of one star hitter being out?
Yes, but not by as much as people assume. A missing slugger changes the home-run distribution more than the run-scoring rate. Expect totals to drop by a quarter to half a run for an everyday power bat scratched after the line is posted, and adjust your projection accordingly before deciding whether the market has overreacted.
How does a 4-game series shift totals lines?
Four-game series concentrate bullpen fatigue. Games three and four typically have higher totals than games one and two because both pens have been worked, and the bookmaker bakes that in. The angle is not the headline total but the back-of-bullpen matchups, which is where most of the late-inning scoring happens.
Written by the editors at mlb Betting Systems.