MLB Home Run Props: Finding Value on Player Power Bets
 Available in US
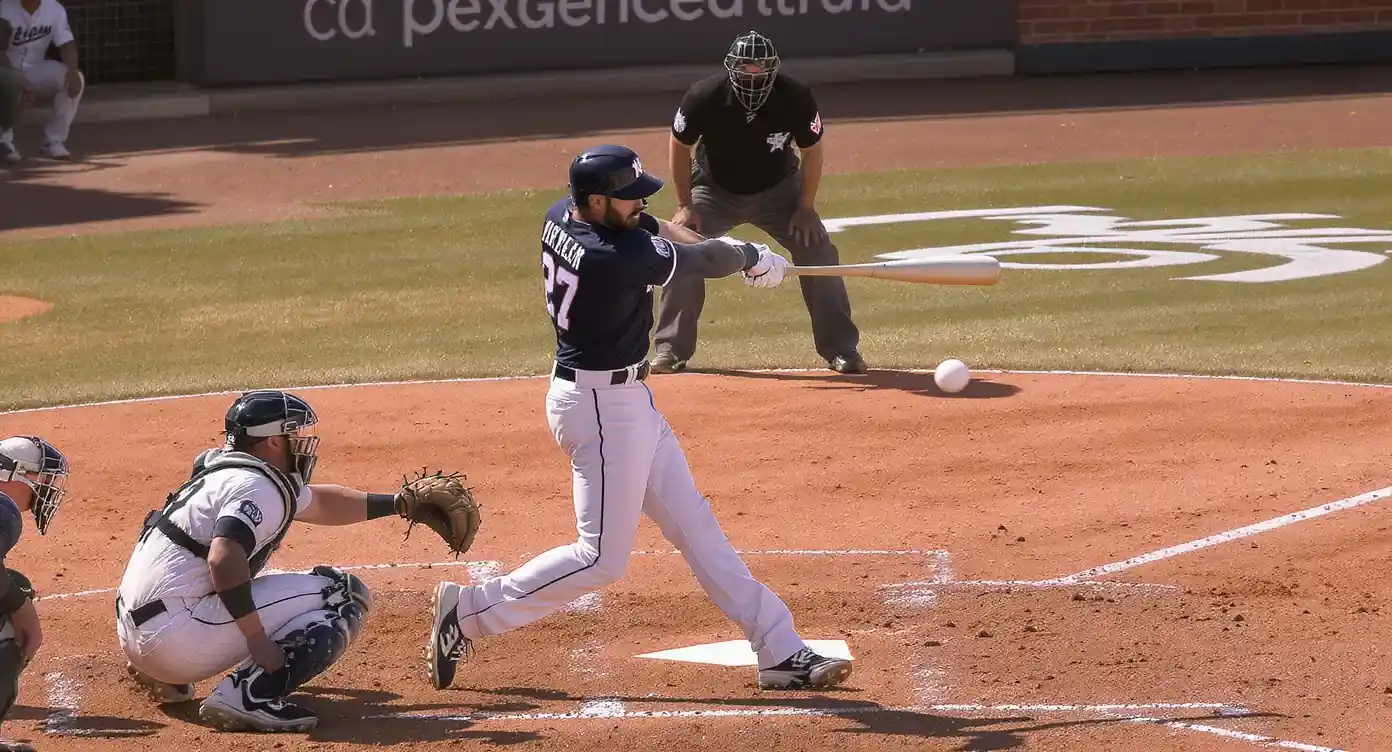
I once watched Aaron Judge homer in three consecutive games, and my mlb home run props bet on Judge in the fourth game lost at +330 because he walked four times against a left-hander who pitched around him. That sequence taught me what home-run props actually are: short, volatile, structurally underpriced if you do the work, and a fast way to bleed bankroll if you don’t. The prop looks easy because everyone knows what a home run is. The market is harder than it looks because four or five variables stack up before a single batter even comes to the plate.
This is the framework I run on every HR prop I bet – the metrics that matter for power, how the park and weather shift the projection, what the pitcher matchup does, and why lineup spot is the most overlooked variable in the whole stack. UK bettors will recognise the basic moneyline maths from elsewhere, but HR props have a structural quirk: the bookmaker margin is wide, which means you have to clear a real edge before you’ve paid for the trade.
What an HR Prop Pays
The typical home-run prop is “Player X to hit a home run” with a yes/no outcome. Decimal prices in the UK market for full-game HR props on power hitters typically run between 2.50 and 7.50, depending on the batter, the park, and the matchup. The favourite range – Judge, Ohtani, Schwarber, the elite power profiles – sits closer to 3.00 to 4.00 on most game days. Mid-tier bats run 5.00 to 7.00. Spot starters and bottom-of-the-order hitters can go 10.00 or longer.
The implied probability range maps cleanly: 3.00 implies 33.3 percent, 5.00 implies 20 percent, 7.50 implies 13.3 percent. The “fair” probabilities – once you’ve stripped the bookmaker’s margin – are 3 to 5 percentage points lower than the displayed implied. So a 3.50 prop is implying 28.6 percent, and the bookmaker is probably thinking the true probability is closer to 25 percent. You need your own estimate to be measurably higher than 25 percent for the bet to have positive expected value.
The overround on HR props at UK books often runs 108 to 112 percent – significantly wider than the 102 to 104 percent on a standard moneyline. That gap is the bookmaker’s protection against the high variance of single-event props. As a bettor, the practical implication is that marginal edges don’t survive the margin. You need a real, measured edge of 5 to 8 percentage points over the bookmaker’s implied price to clear the trade. Anything smaller, and the bookmaker keeps your stake over volume.
Barrel Rate and Power Metrics
The single best predictor of home-run output for a specific batter on a specific day isn’t season home runs. It’s barrel rate – the percentage of batted balls that meet Statcast’s barrel criteria for exit velocity and launch angle. Barrels are the contacts that produce home runs at the highest rate, and barrel rate is much more stable across short samples than home-run rate itself.
A 12 percent barrel-rate batter is in the elite tier. 8 to 10 percent is upper-second-tier. Below 6 percent, the batter is structurally unlikely to homer with regularity regardless of name recognition. In 2025, four players posted 50-plus home runs in a single season – Raleigh, Schwarber, Ohtani, Judge – and all four were among the top tier in barrel rate. The metric doesn’t pick lucky outliers; it predicts the next swing.
Beyond barrel rate, three supporting metrics fill out the picture. Hard-hit percent – the share of batted balls at 95 mph or higher – captures the raw exit velocity floor. Batters who don’t hit the ball hard rarely produce sustainable home-run output regardless of swing path. Isolated Power (ISO) – slugging percentage minus batting average – captures extra-base production stripped of singles. Expected slugging (xSLG) accounts for the quality of contact and shows what slugging “should” have been given exit velocity and launch angle, which is useful for spotting batters in cold or hot streaks who are due to regress.
For the actual HR prop work, I want a batter with barrel rate at 8 percent or higher, hard-hit percent above 40 percent, and recent xSLG indicating either current form or imminent regression toward power. That filter eliminates most of the prop market and concentrates the bets on profiles where the structural inputs support the line.
Park and Weather Overlay
Park factors for home runs aren’t uniform across the league. Some parks suppress home runs by 15 percent or more against league average; others inflate them by similar margins. Sutter Health Park in Sacramento – the Athletics’ interim home in 2025 – posted a +10 percent runs and +5 percent home runs factor relative to the league average. Coors at altitude is a separate world entirely. The HR factor at any specific park is a multiplier you apply directly to the batter’s expected probability.
The bigger overlay is wind. Games with wind blowing out to the outfield produce 7.6 percent more home runs than games with neutral or in-blowing wind. That’s the StatPro Blog research, and it matches what every park-watcher has observed. Wrigley with wind out is a different park from Wrigley with wind in. The same is true at every venue, and the effect compounds for batters whose contact profile is fly-ball heavy.
Temperature matters too, though more gradually – every 10 degrees Fahrenheit adds roughly 1 percent of carry distance. A 90-degree day game at a hitter’s park with wind out is the maximum environment for HR props. A 55-degree afternoon at a pitcher-friendly park with wind in is the minimum. The prop lines do move with conditions, but not always enough to fully price the extremes.
The cross-reference on park and weather data is straightforward – Baseball Savant for the park factors, the National Weather Service for the venue-specific forecast. The work takes five minutes per game. The bettor who skips it is paying the bookmaker for information that’s freely available.
Pitcher Matchup
The pitcher facing the batter is the second-largest input to a home-run probability. The relevant metric is the pitcher’s home-runs-allowed per nine innings (HR/9), supplemented by their flyball percent and platoon splits against the batter’s handedness.
A pitcher with HR/9 above 1.5 and flyball percent above 38 percent is a structural target for HR props. He’s giving up the ball in the air regularly, and a meaningful share of those flies leave the yard. A pitcher with HR/9 under 1.0 and a strong groundball profile – say 50 percent groundballs or higher – is a much harder matchup. Most fly balls don’t leave the yard, and most contacts are on the ground where home runs structurally don’t happen.
Platoon splits add the final layer. A left-handed batter against a left-handed pitcher loses something like 30 percent of their typical home-run rate. A right-handed batter against a left-handed pitcher who struggles against righties gains a similar percentage. The platoon effect is real, well-measured, and often partially missing from the prop line, especially in less-watched matchups.
The combined matchup analysis – pitcher HR/9, flyball percent, platoon splits – moves the batter’s baseline HR probability by 20 to 40 percent in either direction. A 25 percent baseline batter can become 32 percent against the right matchup or 18 percent against the wrong one. The bookmaker prices the average. You can identify the deviations.
Lineup Spot and Volume
The most overlooked variable in HR props is plate appearances. A leadoff batter typically gets 4.5 PA per game. A cleanup batter gets 4.2 PA. A seven-spot batter gets 3.8 PA. A nine-spot batter gets 3.5 PA. The difference between a leadoff hitter and a nine-spot hitter is essentially one extra plate appearance per game – about a 25 percent increase in HR opportunity for the same batter.
That swing is enormous in prop terms. A batter you’d otherwise project at 25 percent HR probability at cleanup might project closer to 22 percent at seventh in the lineup, simply because he gets fewer chances. Conversely, a batter moved up the order for a single game – sometimes because of injuries, sometimes because of platoon-specific lineup construction – sees his HR probability jump above the bookmaker’s price, which was set on his usual lineup spot.
For day-after-night games and travel games, lineups can shift more than usual. Star players get rested. Bench players move up. The prop line for the star resting at the bottom of the order or out of the lineup entirely is dead – you need to know before placing. Lineup announcements come out 90 minutes to 2 hours before first pitch. Place props after the lineup is confirmed, not before, especially for matchups where rest is possible.
For UK bettors going deeper on prop-related metrics, the Statcast framework that underpins barrel rate also feeds into expected stats and the wider Statcast metrics for MLB betting like xwOBA and exit velocity – the data ecosystem is the same, just applied at different layers of the prop research.
Putting the Stack Together
The HR prop framework comes down to five compounding filters. Batter with barrel rate 8 percent or higher and hard-hit percent above 40 percent. Park HR factor above 100, meaning the venue inflates rather than suppresses. Wind out at 8 mph or more, or neutral with warm temperature. Pitcher with HR/9 above 1.3 and matching platoon split exposure. Confirmed top-of-order lineup spot – 1 through 5.
All five align on maybe one or two games per slate. Those are the prop bets. Everything else is either marginal or losing the bookmaker’s margin to the wide overround on HR markets. The disciplined HR-prop bettor places one or two bets a day, not eight or ten. That selectivity is what separates a long-term winning prop record from a long-term losing one.
Is the longest-distance hitter the best HR-prop bet?
Not necessarily. Maximum distance captures peak exit velocity, but most home runs are merely sufficient – clearing the wall, not setting records. Barrel rate, which captures the frequency of barrelled contact, is a better predictor than maximum distance. Maximum distance batters with poor contact rates can have lower HR probabilities than steady barrel-rate hitters.
Does batting first or second always beat batting fourth on HR props?
In raw plate-appearance terms, yes – leadoff and second hitters get roughly one extra PA per game compared to middle-of-order spots. But cleanup hitters typically have higher per-PA HR rates because they’re better hitters. The right question is which effect dominates for a specific player. Mid-tier power hitters moved to leadoff often gain HR-prop value.
How do day games affect home-run props?
Day games tend to be warmer than night games at most venues, which adds 1 to 2 percent of carry distance through the temperature effect. Day games also tend to have more variable wind patterns. The net effect on HR probability is slightly positive, but the variance increases – making prop lines harder to read consistently.
Written by the editors at mlb Betting Systems.