Wrigley Field Totals Strategy: Wind Direction and Weather Betting
 Available in US

A May afternoon at Wrigley Field, 2019. Cubs vs Pirates, total set at 8.5. The morning forecast had light winds, maybe 5 mph variable. By first pitch the wind was gusting 18 mph straight out to centre. The over hit by the fifth inning. I’d bet the under at 8.5 with an opinion on the pitching matchup, and I gave the bet back inside two hours because I ignored the most important variable in Chicago: the wind. The wrigley field wind betting angle is the closest thing to a free edge any UK MLB punter can build, because the conditions are publicly available, the physics are settled, and most casual money doesn’t bother checking the forecast before placing the bet.
Below is what the wind actually does to baseballs at Wrigley, how to read the forecast in a way that maps to betting decisions, and where the wind angle has already been baked into the price by the time you see it. The key is that the wind matters, and not all wind matters equally.
Stadium Architecture and Ball Flight Resistance
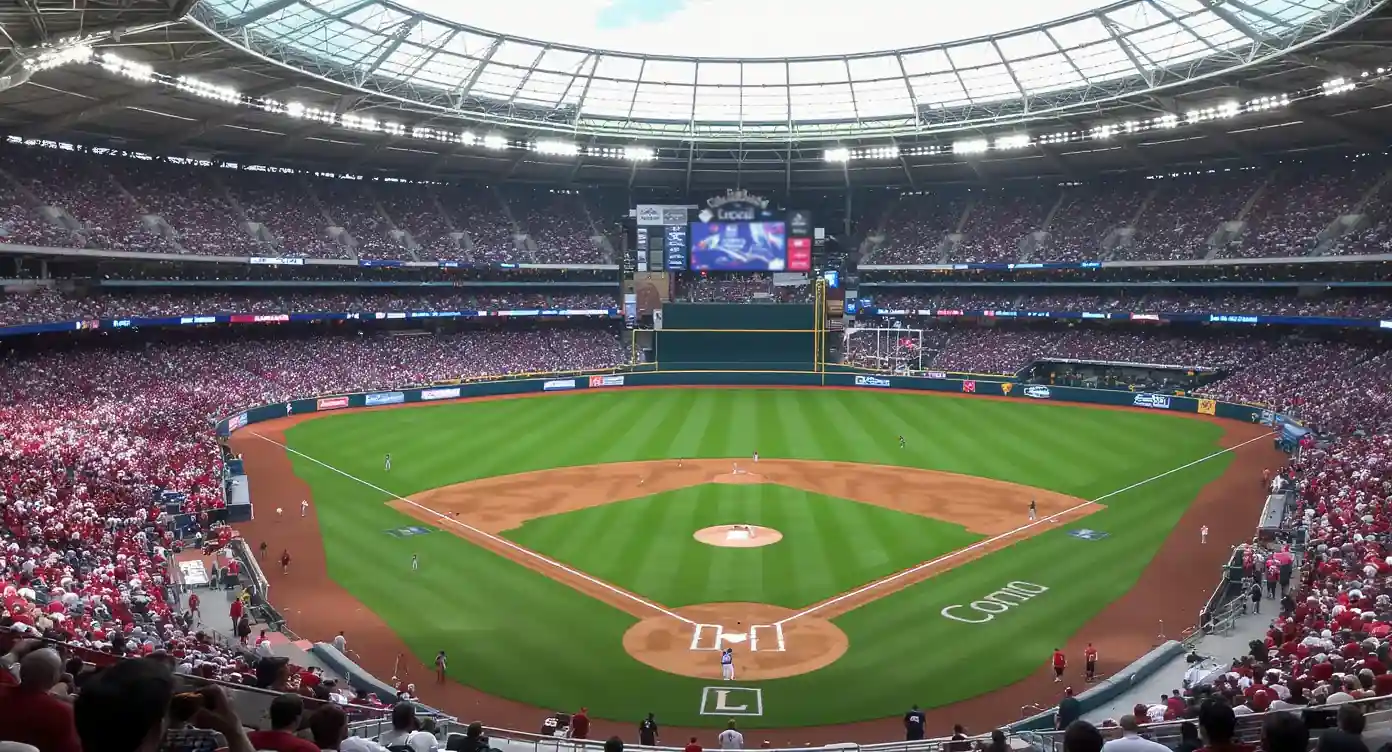
Wrigley sits roughly half a mile from Lake Michigan, which gives the park a wind pattern unlike any other big-league venue. Cold lake air meets warm urban air and produces swirling currents that can shift direction by mid-game. The park’s orientation – home plate facing northeast – means a south or southwest wind blows out toward centre field, and a north or northeast wind blows in from the lake. Day games are particularly volatile because thermal updrafts can flip the pattern after first pitch.
The underlying physics is settled. Dr. Alan Nathan, the baseball physicist whose work underpins most public Statcast research, put it cleanly: “Adding a mere 5 mph worth of wind behind a ball can add nearly 19 feet of travel distance.” Scale that up. A 10 mph tailwind adds roughly 19 feet of carry, more than enough to push a fly ball over the basket and into the bleachers. A 15 mph tailwind adds nearly 30 feet – that’s a warning-track flyball turning into a home run, repeatedly, across nine innings.
The reverse is brutal. A 10 mph wind in from centre cuts roughly 19 feet of carry, and at 15 mph or more the home-run output drops by close to a third. What looks like a routine fly ball from contact ends up as a long fly out to the warning track. The same swing in the same conditions a week earlier produces a different result based purely on which direction the flag at Wrigley is pointing.
The effect compounds across a game. Games with sustained outfield wind – meaning 10 mph or more blowing out, holding for most of the contest – produce 5.8 percent more runs and 7.6 percent more home runs than games with neutral or in-blowing wind. That’s the StatPro Blog research, and it matches what veteran Wrigley watchers have known for decades. The flagpole isn’t decoration. It’s the leading indicator for total runs.
Reading the Pre-Game Forecast
The first thing I check on a Wrigley game day is the hour-by-hour wind forecast for the venue. The National Weather Service Chicago office, free and publicly accessible, publishes 12-hour wind direction and speed forecasts in 1-hour increments. For a 13:20 local first pitch, you want the forecast for 14:00 through 17:00 – the hours the game will actually be played, not the hours leading up to it.
The variables that matter: wind direction (degrees on the compass, with 180 to 240 being out to centre and 0 to 30 being in from centre), wind speed (steady or gusting), and the trend across the game window (holding, increasing, decreasing). A 12 mph out-to-centre forecast that holds through the entire afternoon is a clean over signal. A 12 mph out-to-centre forecast that decreases to 4 mph by the third inning is a much weaker signal, because only the first inning gets the benefit.
Cross-reference against the Wrigley flagpole. The flag in centre field is visible on every broadcast and updates in real time. If the flag is fully extended toward home plate, the wind is blowing in from centre. Fully extended toward centre, blowing out. Drooping or pointing irregularly, the wind is variable and the forecast was wrong. Casual bettors place their bets in the morning based on the morning forecast. You can check the flag at first pitch and decide whether the conditions match what you priced in.
One subtlety: wind at field level isn’t always the same as wind at the upper deck. The flag is the closest thing to a field-level indicator, but balls travel highest where the upper-deck wind matters. Day games in summer can have a stronger updraft at altitude that the field-level flag doesn’t capture. Worth knowing when the conditions are borderline.
When the Over Shines
The clean over signal at Wrigley has four conditions stacking up. Wind out to centre at 10 mph or more, holding through most of the game window. Temperature 75 Fahrenheit or above, which adds the carry-distance multiplier on top of the wind effect. Two starting pitchers with FIP above 4.20 – meaning the rotation isn’t elite enough to suppress contact. And bullpens that have been overworked in the past three days, increasing the chance of late-game scoring inflation.
When all four line up, Wrigley overs have historically returned strong ROI even after accounting for the bookmaker’s adjustment. The mechanism is that bookmakers do bake wind into the line, but they bake in an average wind day, not the extreme. A 15 mph sustained out-blowing wind at 80 Fahrenheit is materially hotter than the typical Wrigley environment, and the bookmaker’s line doesn’t always move enough to reflect the difference. That’s the gap.
The trap is over-betting Wrigley overs in conditions that only meet one or two of the criteria. A 7 mph crosswind isn’t a wind-out game. A 10 mph wind that flips direction by the third inning isn’t a wind-out game. The signal needs to be persistent and significant. Marginal Wrigley overs are not edges – they’re noise, and the bookmaker has already priced in the marginal case.
When the Under Shines
The under at Wrigley is genuinely under-bet. The park’s reputation as a launching pad makes casual money default to overs, which means under-favourable conditions trade at prices that haven’t been pushed far enough toward fair. Three conditions in particular produce reliable under value.
First, wind blowing in from centre at 10 mph or more, sustained. The carry suppression is so severe that even good hitters struggle to clear the warning track. Total runs drop by 1 to 1.5 below the venue’s neutral expectation.
Second, cool afternoon temperatures, especially in April or late September, with overcast sky. The temperature effect compounds with wind in. A 55-degree game with 12 mph wind in is functionally a different sport from a 78-degree game with 12 mph wind out.
Third, two starting pitchers with command of breaking pitches. Wrigley with wind in turns into a pitcher’s park, and starters who can locate the curveball or slider take full advantage. Mid-rotation starters with FIP under 3.80 are typically enough.
The under bettor’s mistake is forgetting that the public bias toward overs means the under price often offers value the over price doesn’t. Even when conditions are neutral and the line is fairly set, the under is often the better trade simply because the over is more popular and therefore slightly shaded longer than fair. It’s not a structural edge, but it’s a small ongoing margin you can capture as long as casual money keeps defaulting to the over.
The Limits of the Wind Edge
Two warnings before anyone treats this as a printing machine. The first is that bookmakers do read the same forecast you do. By the time you see a Wrigley line in the late morning UK time, the wind forecast is already in the price. The edge isn’t betting Wrigley overs in wind. It’s betting Wrigley overs when the wind forecast is more extreme than the line has accounted for, or when the wind forecast changes after the line is set.
The second warning is that afternoon wind at Wrigley can flip. A morning forecast of 12 mph out can become a 6 mph crosswind by the third inning. Day games in summer, in particular, are vulnerable to thermal pattern shifts. The over bettor who placed at 22:00 GMT the night before is betting on a forecast that may be 12 hours stale by first pitch. Worth checking the latest update an hour or two before first pitch if the bet is large enough.
For HR-prop bets on Cubs games, the same wind analysis becomes a player-level question – exit velocity, batter spray angles, and lineup position interact with wind direction in ways the totals analysis only partially captures. The same Statcast research that underpins the 19-feet-per-5-mph effect drives the deeper framework for finding value on MLB home-run props, and Wrigley wind is one of the clearest park-level inputs to that framework.
Where the Edge Genuinely Lives
Wrigley is a wind game more than a baseball game on roughly a quarter of its home dates. Those are the days where the edge exists, the conditions are extreme enough that the line hasn’t fully priced them, and the bettor who actually checked the forecast trades against the bettor who didn’t. The other 75 percent of Wrigley games, you skip. Park-factor mythology – “Wrigley is a hitter’s park” or “Wrigley with wind in is a pitcher’s park” – is true on average and useless for a single game. The single-game work is in the wind report, and that work pays whenever you do it.
Where can UK bettors check Wrigley’s pre-game wind forecast?
The National Weather Service Chicago office publishes free hour-by-hour forecasts at weather.gov, broken out by location. You want the forecast for the actual game hours, not the morning. Cross-reference against the Wrigley flagpole on the broadcast for real-time validation of how the day is actually playing versus the forecast.
Does the Wrigley flagpole flag direction match the field-level wind?
Closely, but not perfectly. The flag captures field-level wind reasonably well. Upper-atmosphere wind can differ, particularly on summer day games when thermal updrafts develop. For most betting purposes the flag is the best single indicator available in real time. For pre-game decisions, use the hourly NWS forecast.
Is the wind-out edge already baked into the over price?
Partially. Bookmakers do adjust totals for forecast wind, but the adjustment captures the average expected case, not the extreme. When wind is 15 mph or more sustained, the line typically doesn’t move enough to reflect the full effect. The structural edge sits in extreme wind days, not in any wind day.
Published by the mlb Betting Systems team.